process-mining
2021.10
true
Process Mining user guide
- Release notes
- Getting started
- Installation
- Configuration
- Integrations
- Authentication
- Working with Apps and Discovery Accelerators
- AppOne menus and dashboards
- AppOne setup
- TemplateOne 1.0.0 menus and dashboards
- TemplateOne 1.0.0 setup
- TemplateOne menus and dashboards
- TemplateOne 2021.4.0 setup
- Purchase to Pay Discovery Accelerator menus and dashboards
- Purchase to Pay Discovery Accelerator Setup
- Order to Cash Discovery Accelerator menus and dashboards
- Order to Cash Discovery Accelerator Setup
- Basic Connector for AppOne
- SAP Connectors
- Introduction to SAP Connector
- SAP input
- Checking the data in the SAP Connector
- Adding process specific tags to the SAP Connector for AppOne
- Adding process specific Due dates to the SAP Connector for AppOne
- Adding automation estimates to the SAP Connector for AppOne
- Adding attributes to the SAP Connector for AppOne
- Adding activities to the SAP Connector for AppOne
- Adding entities to the SAP Connector for AppOne
- SAP Order to Cash Connector for AppOne
- SAP Purchase to Pay Connector for AppOne
- SAP Connector for Purchase to Pay Discovery Accelerator
- SAP Connector for Order-to-Cash Discovery Accelerator
- Superadmin
- Dashboards and charts
- Tables and table items
- Application integrity
- How to ....
- Working with SQL connectors
- Introduction to SQL connectors
- Setting up a SQL connector
- CData Sync extractions
- Running a SQL connector
- Editing transformations
- Releasing a SQL Connector
- Scheduling data extraction
- Structure of transformations
- Using SQL connectors for released apps
- Generating a cache with scripts
- Setting up a local test environment
- Separate development and production environments
- Useful resources
KPIs and chart descriptions for the Overview dashboard displayed to users with the Analyst role in Process Mining standalone.
Introduction
The dashboard Overview – Dashboard that is shown when selecting the Analyst role can be used to get a global overview of the data. See illustration below.
KPIs
Below is a description of the KPIs that are displayed on the top.
| KPI | Description |
|---|---|
| Cases | Total number of cases during the selected period. |
| Events | Total number of events during the selected period. |
| Activities | Total number of activities during the selected period. |
| Variants | Total number of process variants during the selected period. |
| Users | Total number of users that performed activities during the selected period. |
Dashboards charts
Below is a description of the dashboard charts of the Overview - Dashboard.
| Chart | Description |
|---|---|
| Events | A history graph that displays the number of events over the selected period of time. |
| Variants | Displays the process variants that occur most frequently. |
| Events per case | Displays the percentage of cases containing a certain number of events. |
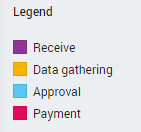
| Activities | Displays all activities and the percentage of cases in which they occur. It also shows how often the activity is repeated. The color of the bar indicates the activity type. See illustration below. |