process-mining
2021.10
true
- 发行说明
- 入门指南
- 安装
- 配置
- 集成
- 身份验证
- Working with Apps and Discovery Accelerators
- AppOne 菜单和仪表板
- AppOne 设置
- TemplateOne 1.0.0 菜单和仪表板
- TemplateOne 1.0.0 设置
- TemplateOne menus and dashboards
- TemplateOne 2021.4.0 设置
- Purchase to Pay Discovery Accelerator 菜单和仪表板
- 购买到付款 Discovery Accelerator 设置
- Order to cash Discovery Accelerator 菜单和仪表板
- “订单到现金” Discovery Accelerator 设置
- Basic Connector for AppOne
- SAP Connectors
- 适用于 AppOne 的 SAP 订单到现金连接器
- 适用于 AppOne 的 SAP 采购到付款连接器
- SAP Connector for Purchase to Pay Discovery Accelerator
- SAP Connector for Order-to-Cash Discovery Accelerator
- Superadmin
- 仪表板和图表
- 表格和表格项目
- 应用程序完整性
- How to ....
- 使用 SQL 连接器
- Introduction to SQL connectors
- Setting up a SQL connector
- CData Sync extractions
- Running a SQL connector
- Editing transformations
- 释放 SQL 连接器
- Scheduling data extraction
- Structure of transformations
- Using SQL connectors for released apps
- Generating a cache with scripts
- Setting up a local test environment
- Separate development and production environments
- 实用资源
重要 :
请注意,此内容已使用机器翻译进行了部分本地化。
新发布内容的本地化可能需要 1-2 周的时间才能完成。
Process Mining 用户指南
上次更新日期 2026年5月20日
简介
The Analysis – Compare dashboard can be used to compare two process graphs side by side. This allows you to compare two sets of paths from your process. For example, you compare how small invoices processes, compared to larger invoices, and how you can optimize the process.
You can select the attribute you want to use for the comparison from the Compare attribute selector.
请参见下图。
备注:
您可以使用“详细信息”滑块更改显示的活动和/或边线的数量。
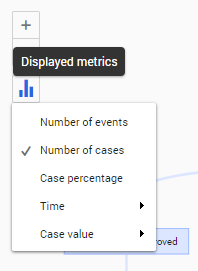
根据不同的指标查看流程
默认情况下,流程图会根据用例数量显示流程。
请按照以下步骤为流程图选择其他指标。
| 步骤 | 操作 |
|---|---|
| 1 | Click on the Displayed metrics icon in the process graph. |
| 2 | 从可用指标列表中选择其他指标。 |
有关示例,请参见下图。
另请参阅使用流程图。