- Getting started
- For administrators
- RPA workflow projects
- Creating an RPA workflow from an idea
- Creating a project
- How to start an RPA workflow
- Managing project files and folders
- Connecting RPA workflows to your accounts
- Configuring activities
- Managing the activities in a project
- Passing values between activities
- Iterating through items
- Managing the data in a project
- Configuring a project to use your data
- Using file and folder resources
- App projects
- Agentic processes
- Agents
- Solutions
- API workflows
- Tests

Studio Web user guide
Debugging app projects
You can debug app projects in two ways.
Using the in-app logging mechanism
You can use the Shift + 4 keyboard shortcut to open the in-app logging mechanism and save a log file to your machine. The debug log uses the JSON format.
There are two logging levels available:
- Info: Logs functional and high-level business-oriented data such as operation start, operation end etc.
- Trace: Logs highly detailed and granular data across every step of the application process and system flow.
To access the in-app logging mechanism:
- Run your app.
- Use the Shift + 4 keyboard shortcut to activate the debugger.
- Select Record. The debug logger starts.
To download the log file to your machine when you are done testing your app:
- Select the Stop button.
- Select the Download button.
From the Studio Web workflow designer
You can also debug app projects in the same way as debugging other Studio Web projects.
To debug your app project, expand the drop-down menu next to the debug button and select the On local machine option (to use a local robot), or the On cloud option (to use cloud robots). You can also use the Debug step-by-step option to debug your project one activity at a time.
Debugging locally requires you to install and run UiPath® Assistant 2024.10.5 or newer.
If the app or any of its automations have errors, the debug buttons will be greyed out until these errors are resolved. Apps and workflows with errors have a small red dot next to their names in the Project Explorer.
After selecting a debug option, Studio Web will automatically build the app and the automation code behind it. After a short while, the app will open in a separate browser tab, and you can test its functionality.
Make sure your browser's pop-up blocker is not preventing the app from opening. If the app does not open automatically, a tooltip opens.
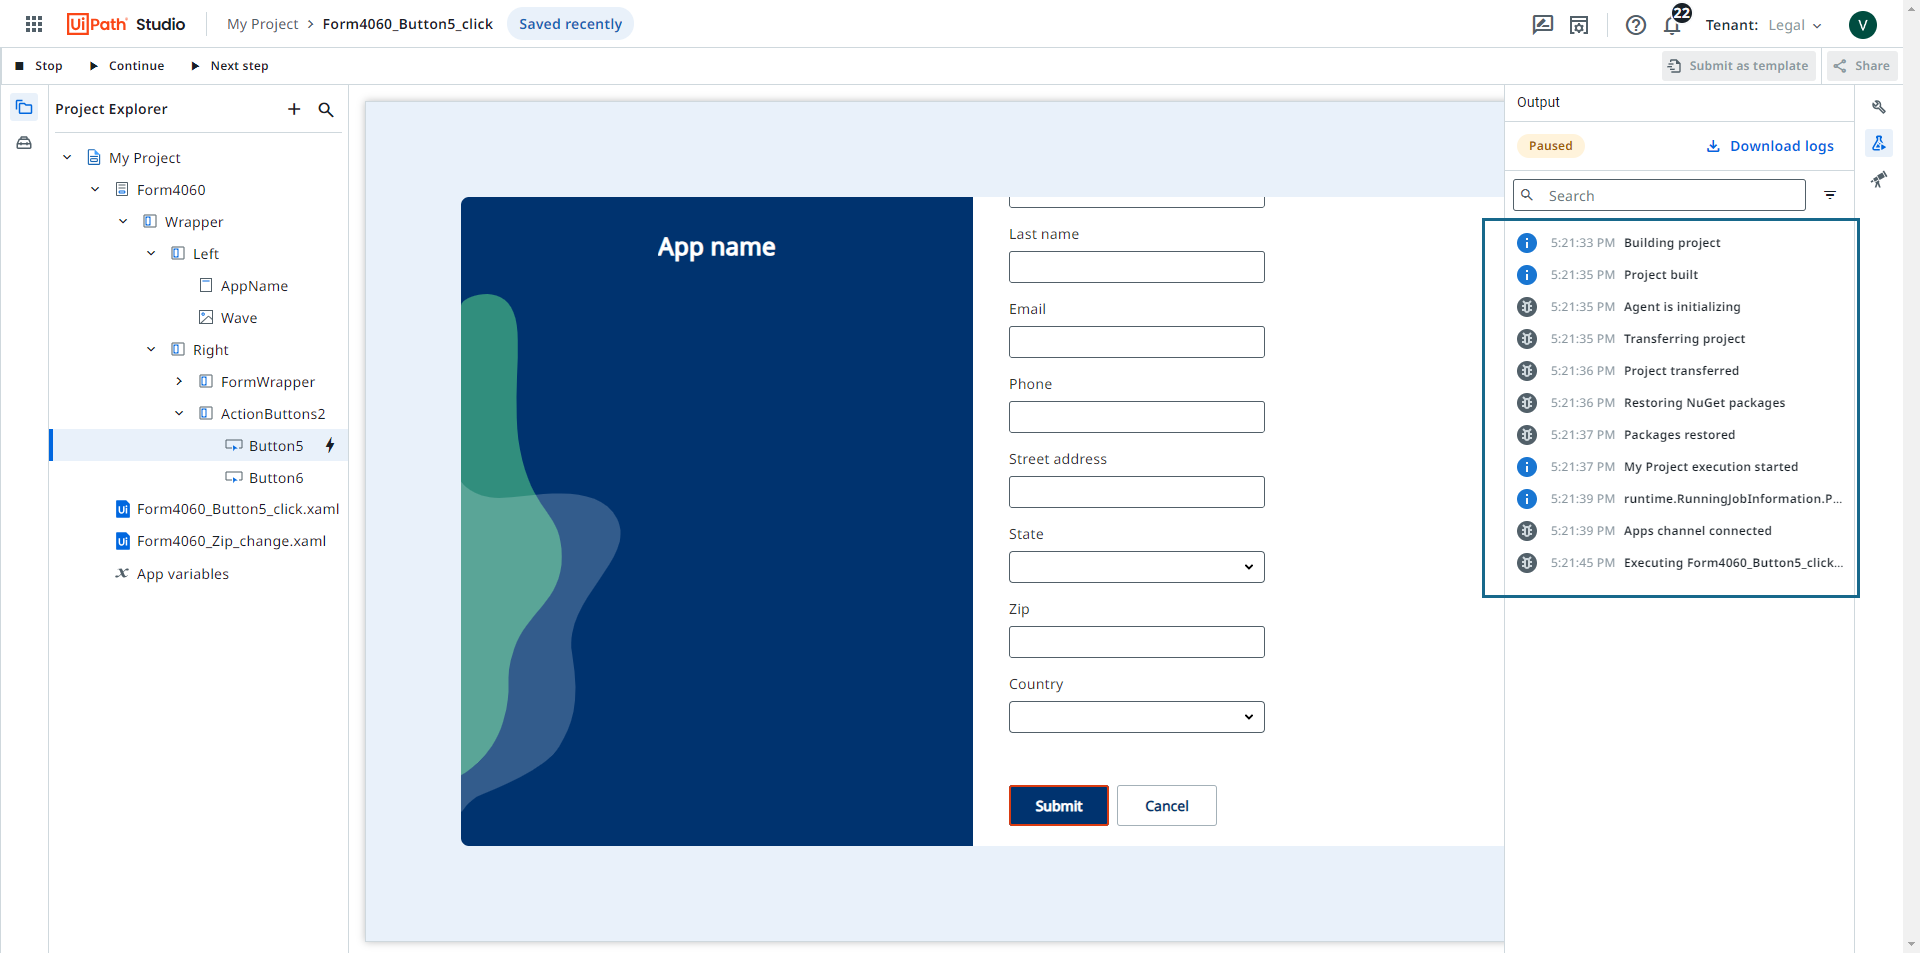
While the app is running, you can switch back to the Studio Web designer. Notice that the app project is now running in debug mode. You can now click and interact with the automations triggered by the app events and view their progress in the Output panel.

You can also set breakpoints on activities to see how automations are executed.
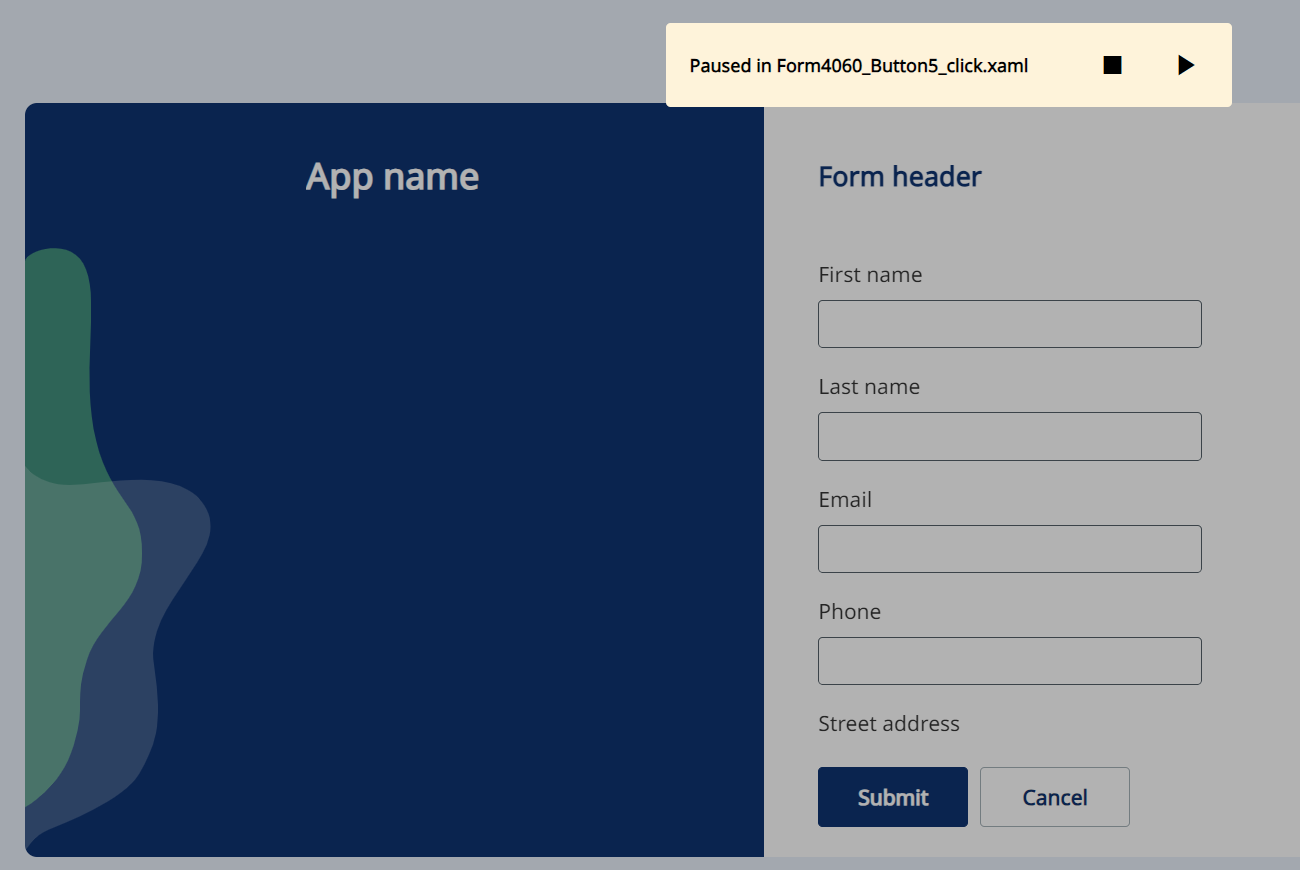
When a breakpoint is triggered in an automation, the app will pause execution with the message Paused in WorkflowName.xaml. You then have the option to stop or continue running the app.

Opening the Watches panel shows you the values of the variables up to the point where the execution reached the paused activity.
Select the Continue button from the top ribbon to continue running the entire workflow, or Next step to advance to the next step in your automation. Select Stop to end the debugging process and return to your app project.