- Getting started
- For administrators
- RPA workflow projects
- Creating an RPA workflow from an idea
- Creating a project
- How to start an RPA workflow
- Managing project files and folders
- Connecting RPA workflows to your accounts
- Configuring activities
- Managing the activities in a project
- Passing values between activities
- Iterating through items
- Managing the data in a project
- Configuring a project to use your data
- Using file and folder resources
- App projects
- Agentic processes
- Agents
- Solutions
- API workflows
- Tests

Studio Web user guide
Debugging solutions
Debugging your solution works by testing each individual project that is included in the solution. For information on how to debug each type of project, refer to Running a project (for RPA workflow projects), Managing API workflows (for API workflows), Debugging app projects (for app projects), Debugging an agentic process (for agentic process projects), and Testing the agent (for agent projects).
The Debug on local machine option is only available for RPA workflow projects and app projects.
Resource provisioning
When working in the context of a solution, all the required resources are available for the debugging session. This means that a resources either:
- Has already been created in the UiPath PlatformTM before the debugging session or
- Is only defined within the solution and is automatically created when initiating the debugging session.
Note:
As the resource configuration changes, the created resource is automatically upgraded to reflect these changes.
For resources that are automatically created when initiating the debugging session, a debug folder is also automatically created in your Personal Workspace in Orchestrator. The new Orchestrator folder is named Debug_[Name of the Solution].

You can also manually trigger solution provisioning for debugging:
- Navigate to the toolbar above the Studio Web designer.
- Select the
 arrow next to the debugging environment.
 - Select Deploy solution for testing from the drop-down menu.
Debugging resources
The resources that are used for the debugging session are:
- The available resources that have been selected in the activity from the Available resource section, in case they exist.
- The created resources, in case they were created before the debugging session.
The Debug configuration window
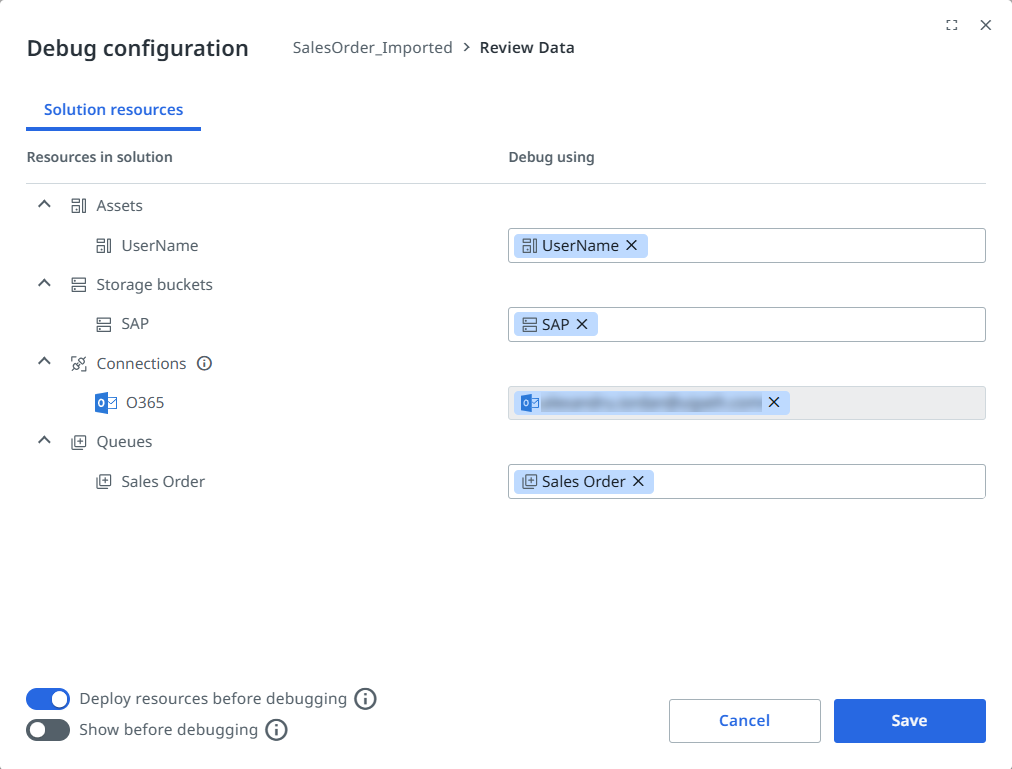
The Debug configuration window gives you access to resources used during the debugging process, as well as input arguments found in the solution.
To access the Debug configuration window:
- Navigate to the toolbar above the Studio Web designer.
- Select the
 arrow next to the debugging environment.
 - Select Debug configuration from the drop-down menu.
Resource categories are grouped under the Solution resources tab. You can expand each category to see individual resources.
Under the Debug using column, a message inside the search bar informs you that resources are deployed in the debug folder.
To choose which resource is used during debugging, click inside the search bar and choose a resource available in the solution or in the UiPath PlatformTM. Platform resources are selected by default and can be removed by selecting the Remove icon next to the resource name.
Available input arguments appear under the Entrypoint arguments tab. You can set argument values directly in the default view or you can switch to the code editor from the  button.
Inside the Debug configuration window, you can also enable:
-
The Deploy resources before debugging option, to speed up the debugging process by provisioning resources only for the current project. If the option is not enabled, no resources are deployed.
-
The Show before debugging option, to make the window appear when you start a debugging session.

Creating resources for debugging
Because all resource definitions are part of the solution, the solution code can easily be shared with other users and all required resources are automatically created and ready for debugging. However, you can choose not to create resources before debugging by disabling the Deploy resources before debugging option in the Debug configuration window. With this option disabled, debugging starts the current project, but no resources are deployed.
This option is designed to speed up debugging when you only need to test an automation that does not rely on specific resources. However, if the automation expects a resource to exist and that resource has not been deployed, an error occurs.
Regardless of the enabling or disabling the Deploy resources before debugging option, you can always deploy the entire solution for debugging by selecting Deploy solution for debugging.

Specifying different resources for debugging
Although resources are automatically provisioned for debugging, they might not be the ones that you intend to use. If this is the case, you specify which resources to use for debugging in the Debug configuration window. You can use resources that:
- Do not yet exist in the UiPath Platform, but will be created for debugging.
- Were previously created for debugging
- Exist in a different folder.
Testing different inputs
When debugging, you can test different input values. You can define these inputs from the Entrypoint arguments tab in the Debug configuration window.
If no specific input arguments are set, the default argument values, if available, are used.
