- Release notes
- Getting started
- Installation
- Configuration
- Integrations
- Authentication
- Working with Apps and Discovery Accelerators
- AppOne menus and dashboards
- AppOne setup
- TemplateOne 1.0.0 menus and dashboards
- TemplateOne 1.0.0 setup
- TemplateOne menus and dashboards
- TemplateOne 2021.4.0 setup
- Purchase to Pay Discovery Accelerator menus and dashboards
- Purchase to Pay Discovery Accelerator Setup
- Order to Cash Discovery Accelerator menus and dashboards
- Order to Cash Discovery Accelerator Setup
- Basic Connector for AppOne
- SAP Connectors
- Introduction to SAP Connector
- SAP input
- Checking the data in the SAP Connector
- Adding process specific tags to the SAP Connector for AppOne
- Adding process specific Due dates to the SAP Connector for AppOne
- Adding automation estimates to the SAP Connector for AppOne
- Adding attributes to the SAP Connector for AppOne
- Adding activities to the SAP Connector for AppOne
- Adding entities to the SAP Connector for AppOne
- SAP Order to Cash Connector for AppOne
- SAP Purchase to Pay Connector for AppOne
- SAP Connector for Purchase to Pay Discovery Accelerator
- SAP Connector for Order-to-Cash Discovery Accelerator
- Superadmin
- Dashboards and charts
- Tables and table items
- Application integrity
- How to ....
- Working with SQL connectors
- Introduction to SQL connectors
- Setting up a SQL connector
- CData Sync extractions
- Running a SQL connector
- Editing transformations
- Releasing a SQL Connector
- Scheduling data extraction
- Structure of transformations
- Using SQL connectors for released apps
- Generating a cache with scripts
- Setting up a local test environment
- Separate development and production environments
- Useful resources
Process Mining user guide
Introduction
Analysis - Event analysis is the dashboard where you can analyze the complete process regarding events.
See the illustration below.
Context information
The context bar at the top of the Analysis - Event analysis dashboard displays context information and KPI's.
Below is a description of the elements of the context bar.
| Element | Description |
|---|---|
| Average number of events | The average number of events that were performed on cases. |
| Average event throughput time | The average throughput time of all events. |
| Number of events | The total number of events. |
| Number of cases | The total number of cases created. |
Events
The Events dashboard item enables you to select various attributes and metrics to analyze events.
Below is a description of the metrics that can be selected in the Events dashboard item.
| Metric | Description |
|---|---|
| Number of events | The number of unique events for cases that were created within the selected period. |
| Percentage of events | The percentage of events for cases that were created within the selected period, related to the total number of events. |
| Percentage of cases | The percentage of cases that were created within the selected period, related to the total number of cases. |
| Avg. number of events | The average number of events that were performed on cases that were created within the selected period. |
| Avg. event throughput time | The average throughput time of all events,for cases that were created within the selected period. |
| Median event throughput time | The median throughput time of all events, for cases that were created within the selected period. |
Distribution
The Distribution chart enables you to analyze the frequency of events based on the Throughput time. See the illustration below.
Process graph
The process graph displays the end-to-end process based on the number of cases. See the illustration below.
You can use the Detail slider to change the number of activities and/or edges shown.
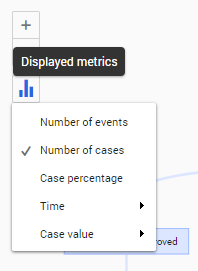
Viewing the process based on a different metric
Follow these steps to select a different metric for the process graph.
| Step | Action |
|---|---|
| 1 | Click on the Displayed metrics icon in the process graph. |
| 2 | Select a different metric from the list of available metrics. |
See the illustration below for an example.
See also Working with Process Graphs.