- Getting started
- UiPath Agents in Studio Web
- UiPath Coded agents

Agents user guide
Building an agent in Studio Web
This section walks you through how to build an agent in Studio Web. To make reliable production-grade agents, we highly recommend you check out Best practices.
Exploring the agent workspace
Use the main Studio Web designer canvas to design your agent, and the left and right panels to explore the agent structure and resources.
Choosing your canvas type
You can design your agent using two distinct views: Form and Canvas.
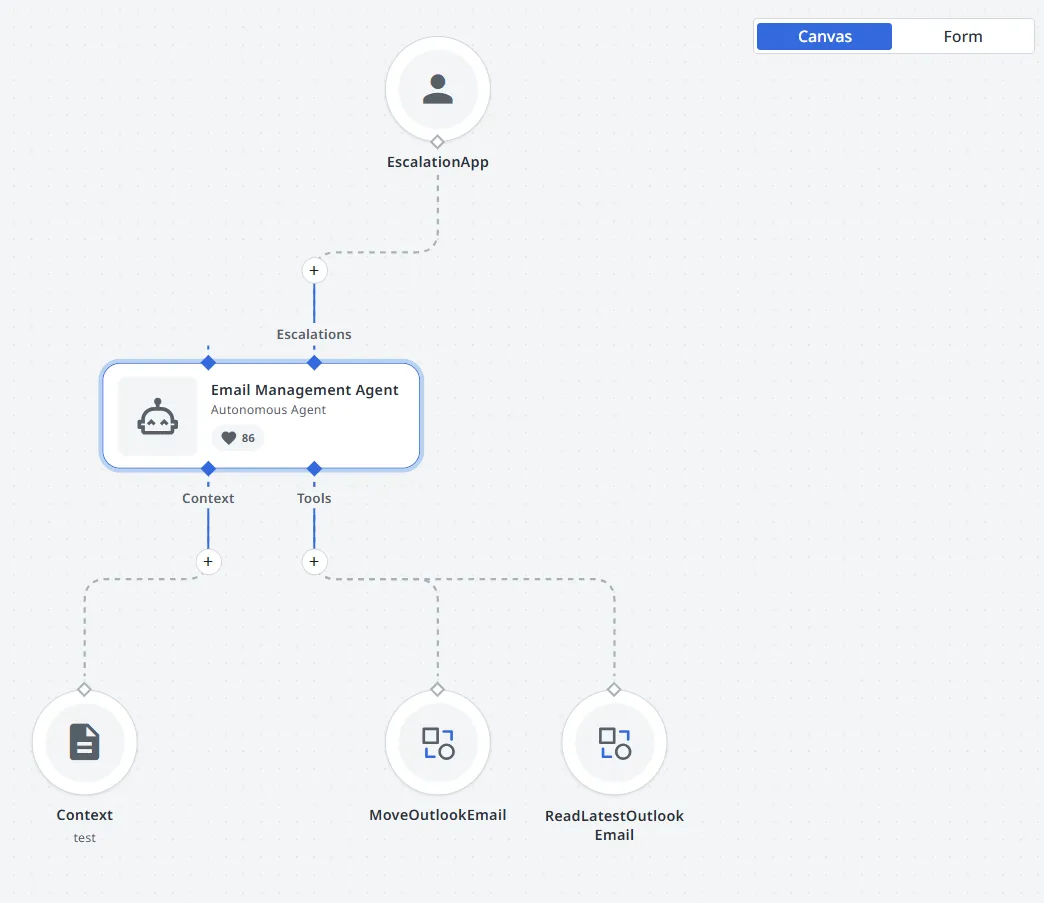
- Canvas is a visual canvas. It features a drag-and-drop, node-based visualization where each component (model, prompt, context, tool, or escalation) is represented as a node on the canvas. This view is ideal for users who prefer a graphical and exploratory approach to agent design, enabling them to build, debug, and refine logic through direct manipulation of visual elements.
- Form is the standard, form-based experience of Studio Web. It provides a structured, form-based authoring experience where each component of the agent is configured through dedicated panels and input fields. This view is ideal for users who prefer a tabular or configuration-driven approach to agent design, enabling step-by-step setup, validation, and testing without relying on visual diagrams.
Switch between Form and Canvas modes with lossless synchronization between both experiences. Any property edited in the form is immediately reflected on the canvas, and vice versa.

Canvas view
The Canvas is structured around four main areas:
- Central canvas – The primary design surface where agent logic is represented as connected nodes. The canvas supports zoom, pan, and mini-map navigation for complex agents.
- Left-side panel – Provides access to the Project Explorer, Data Manager, Errors, and Deployment Configuration panels, consistent with the form-based interface.
- Right-side panel – Displays the Properties and Dev tabs, allowing users to edit node attributes or run quick debug tests.
- Bottom panel – Shows Execution Trail, History, and Evaluations, and integrates live trace data during design-time debugging.
Node types on the Canvas canvas
Each node on the canvas represents a logical component in the agent definition:
- Agent node – Define the system and user prompts and expose the schema (input/output arguments) in the Data Manager. Configure the model, temperature, and token settings.
- Context nodes – Link Context Grounding indexes, allowing configuration of query strategy, thresholds, and retrieval limits.
- Tool nodes – Visualize the connected automations, activities, or other agents. Each tool node can be expanded to display input/output schemas, guardrails, and simulation options.
- Escalation nodes – Indicate human-in-the-loop mechanisms and memory links. Selecting them opens the escalation configuration panel with task recipients and outcomes.

Debugging in Canvas view
The Canvas provides real-time visual feedback during debugging:
- Trace streaming: As the agent runs in design time, trace spans appear directly on the canvas, and nodes light up as they are activated in the agent loop.
- Conversational agents: When debugging a conversational agent, a persistent chat window allows users to exchange messages with the agent. Each message triggers a debug run.
- Breakpoints: You can pause an agent’s execution at specific nodes by setting breakpoints. When a breakpoint is reached, the agent stops just before executing that node, letting you inspect its inputs, outputs, and trace data.
Adding notes to the Canvas
Canvas notes let you annotate the Canvas view with free-form text to describe areas of the canvas, document tool purposes, or leave reminders for collaborators.
To add a note:
- In the canvas toolbar, select the Note icon.
- Select a location on the canvas to place the note. A note template appears with placeholder text.
- Select the note and enter your content. Notes support Markdown formatting.
To manage a note, select it to reveal the action icons, then use the available options:
- Edit (pencil icon) — Open the note for editing.
- Change color (colored dot icon) — Apply a color to the note to visually group or categorize canvas areas.
- Delete (trash icon) — Remove the note from the canvas.
You can also drag a note to reposition it anywhere on the canvas, and drag its edges to resize it.
Form view
The Form view offers a structured, panel-based workspace for building and configuring agents through guided inputs. It provides a clear, step-by-step layout suited for precise configuration and validation of agent components.
Layout overview
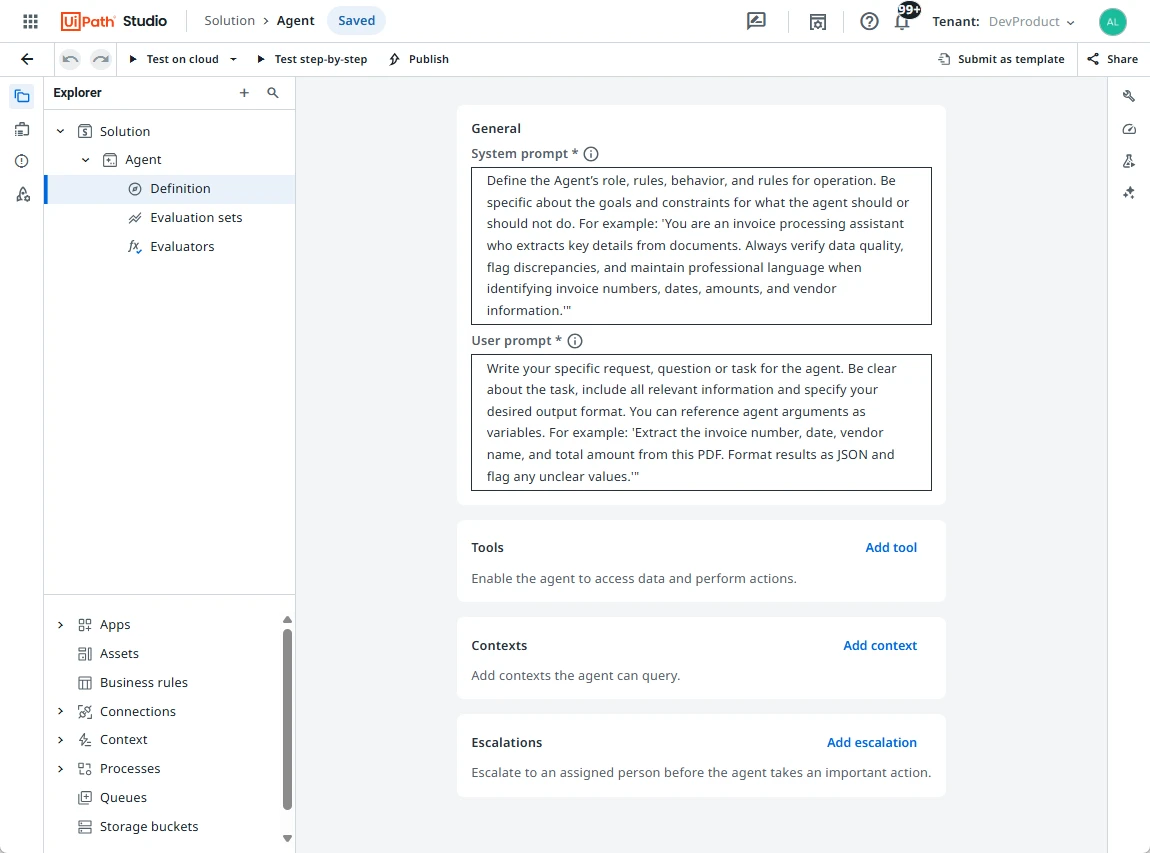
- Agent definition form: Displays the agent definition and its core components, Prompts, Tools, Contexts, and Escalations, organized in a linear, form-based structure.
- Left-side panel: Includes the Project Explorer, Data Manager, Errors, and Deployment Configuration panels for navigating and managing project resources.
- Right-side panel: Contains the Properties and Dev tabs, used to edit component settings, run quick tests, and view design-time traces.
- Bottom panel: Provides access to Execution Trail, History, and Evaluations, showing debug results and evaluation metrics in real time.
Agent configuration
Each section of the form corresponds to a major agent component:
-
Prompts: Define the system and user instructions guiding agent behavior.
-
Tools: Add and configure automations, Integration Service activities, or other agents the agent can call during execution.
-
Contexts: Connect Context Grounding indexes to provide relevant data for reasoning.
-
Escalations: Set up human-in-the-loop actions and enable Agent Memory where needed.
Figure 1. The form view

Debugging in Form view
When testing an agent in Form view, you can run debug sessions directly from the toolbar to verify logic and outputs. Design-time traces appear in the Execution Trail panel, showing inputs, outputs, and any errors for each run. For conversational agents, an integrated chat window lets you exchange messages and observe responses in real time.
Using the Studio Web panels
The left-side panel shows you the agent structure and includes:
- The Project Explorer – Organize and build your agent. Define prompts, tools, context, escalations, and more.
- The Data Manager – Define input and output arguments.
- The Errors panel – See design-time issues, broken configurations, or failed test runs.
- The Deployment configuration panel – Set environment-specific configuration for publishing and running the agent.
The right-side panel includes:
- The Properties panel, split between:
- The Properties tab – Configure agent-level and component-level settings.
- The Dev tab – Run test inputs, debug, and inspect design-time traces.
- Agent score (Preview) – View your agent’s readiness based on evaluation results and test coverage.
- The Run output panel – Review results from the most recent test runs.
- Autopilot (Preview) – Get AI-powered suggestions to refine the prompts, tools, and agent setup.
Figure 2. The Agents workspace

The bottom panel makes evaluations a core part of the design experience by keeping history, results, and live traces all in one place. The available tabs depend on the type of agent you are building:
- For autonomous agents, the bottom panel includes:
- Execution Trail – Shows trace details from the current run. When you execute your agent, this tab opens automatically so you can follow the live traces in real time.
- History – Displays all your agent runs with execution traces and details. From here, you can add runs directly to evaluation sets.
- Evaluations – Lists all your evaluation sets, showing recent scores. Expand a set to see its evaluations, view details, or run tests individually or as a full set.
- For conversational agents, the bottom panel includes:
- Chat – Replaces the Execution Trail tab. Provides an interactive chat window to test conversations with your agent while also displaying the execution trail for each exchange.
- History – Displays all your conversational runs with execution traces and details. From here, you can add runs directly to evaluation sets.
- Evaluations – Lists all your evaluation sets, showing recent scores. Expand a set to see its evaluations, view details, or run tests individually or as a full set.
Creating the agent
- Go to studio.uipath.com.
- Select Create New button, then select Agent.
- Select the agent type:
- Autonomous: Create an agent that acts independently to complete a given task.
- Conversational: Create an assistant that interacts with users through real-time dialogue.
- If you want to create your agent from scratch, select Start fresh.
- If you want to generate your agent using Autopilot, describe the agent you want to create in the available message box, then select Generate Agent. Be as specific as possible, so that Autopilot can efficiently generate an agent.
- The new solution opens, with the Agent designer canvas displayed.
- When configuring your agent, you can choose between two design modes: the traditional Form view and the Canvas view. Both modes share the same underlying agent definition and remain fully synchronized, so you can switch between them at any time without losing data. Use Form view for a structured, step-by-step configuration experience, or switch to Canvas for a visual, node-based layout that lets you see how your agent’s components connect and interact.
Configuring the agent
When configuring your agent, you can choose between two design modes: the traditional Form view and the Canvas view. Both modes share the same underlying agent definition and remain fully synchronized, so you can switch between them at any time without losing data.
Use Form for a structured, step-by-step configuration experience, or switch to Canvas for a visual, node-based layout that lets you see how your agent’s components connect and interact.
Build an agent using Form view (Default)
-
From the Project Explorer panel on the left, access the agent Definition, Evaluation sets, and Evaluators.
Figure 3. The Agent inside a Solution

- The Definition panel is where you design and define the core elements of an agent. The definition contains the following sections: General, Tools, Contexts, and Escalations.
- Use the General section to define the prompts for your agent.
- Use the Tools section to connect runtime tools, like Integration Service connectors or published automations.
- Use the Contexts section to link knowledge sources using Context Grounding indexes to give your agent relevant data access.
- Use the Escalations section to set up human-in-the-loop fallbacks and enable Agent Memory to persist interactions and help calibrate future agent escalations.
- The Evaluation sets panel is where you create evaluations and store results. Evaluations objectively measure your agent's output and assess whether or not it is consistent with your objectives. For details, refer to Evaluations.
- The Evaluators panel is where you create and manage the evaluators used in evaluations.
- The Definition panel is where you design and define the core elements of an agent. The definition contains the following sections: General, Tools, Contexts, and Escalations.
-
First, select your agent under Project Explorer. Right-click to select Rename, and give your agent a unique name. The agent name helps to identify the agent across projects.
-
Next, access the Properties panel from the right-hand side menu to select the large language model you want to use with your agent.
- Select a model from the available dropdown list. Models are provisioned through UiPath AI Trust Layer. For details, refer to Configuring LLMs.
- Configure the Temperature and Max. tokens per response fields. These settings may be controlled by an Automation Ops governance policy. For details, refer to Settings for Studio Web Policies.
- Temperature determines the creativity factor of the LLM generation. You can set a value between 0 (Precise) and 1 (Creative).
- Max. tokens per response refers to the maximum number of tokens to generate with the agent's response. Lower values produce shorter, more concise outputs and help control usage, while higher values allow for more detailed and comprehensive responses.
- Set Max. iterations – The maximum number of reasoning loops the agent can run before it must complete the task or stop.
-
In the agent Definition panel, provide your agent with a System prompt and a User prompt.Add a well-structured prompt to give your agent instructions for what it should do, and constraints it should follow. For details, refer to Prompts.
-
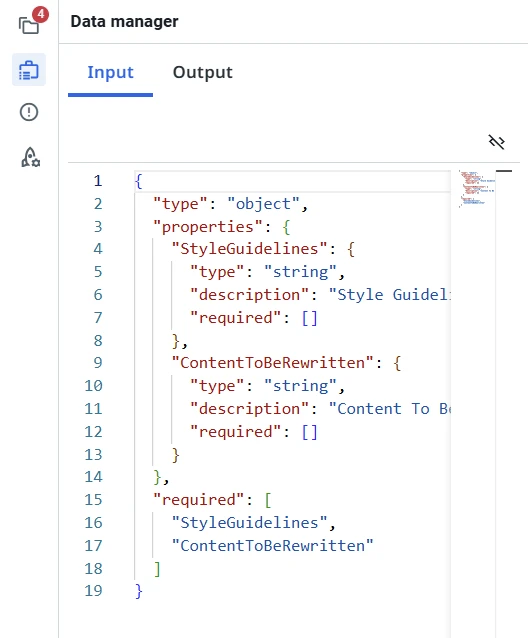
Use the Data Manager panel to define the agent input and output arguments used in the prompts.
Figure 5. Input arguments in the Data Manager panel

-
In the Tools section, select Add tool to add any tools your agent can use during execution.These can be a set of Integration Service activities, existing agents, and published automations to which you have access. Each tool must have a detailed description that helps inform the agent how and when to use this tool. For details, refer to Tools.
-
(Optional) In the Contexts section, select Add context to give the agent access to Context Grounding indexes.Choose an existing index available in your tenant, or select Create new to create a new index directly in Orchestrator. For details, refer to Contexts.
-
(Optional) In the Escalations section, select Add escalation to add a human in the loop through an escalation app and enable Agent Memory.Adding an escalation allows your agent to involve a human to review, approve, or update output as it is running. For details, refer to Escalations and Agent Memory.
Build an agent using Canvas view
-
Open your agent project in Studio Web.
-
In the top-right corner of the design-time canvas, select the Canvas option from the authoring mode toggle.
- The Canvas opens, displaying the agent structure as nodes.
- You can switch back to Form view at any time. All changes are saved and translated automatically between the two modes.
-
Start with the LLM node.
- Select it to open the Properties panel on the right, then choose and configure your model.
- Select a model from the available dropdown list. Models are provisioned through UiPath AI Trust Layer. To learn how to use a custom model, refer to Configuring LLMs.
- Configure the Temperature and Max. tokens per response fields. These settings may be controlled by an Automation Ops governance policy. For details, refer to Settings for Studio Web Policies.
- Temperature determines the creativity factor of the LLM generation. You can set a value between 0 (Precise) and 1 (Creative).
- Max. tokens per response refers to the maximum number of tokens to generate with the agent's response.
- Set Max. iterations – The maximum number of reasoning loops the agent can run before it must complete the task or stop.
- Once a model is selected, the node updates with the corresponding model family icon and the highlight disappears.
- Select it to open the Properties panel on the right, then choose and configure your model.
-
Configure the Agent node.
- The Agent node is created by default alongside the LLM node.
- Open the Prompt section on the right to define your system and user prompts. For conversational agents, this section is simplified and only the system prompt is shown.
- Open the Schema section on the left to define input and output arguments in the Data Manager panel.
-
Add context, tools, and escalations. After completing the LLM and Agent nodes, three new node types become available:
- Context: Select a Context Grounding index and adjust its search parameters.
- Tools: Open the command palette, search for a deployed tool, and add it to your canvas. You can further configure each tool once added.
- Escalations: Add a human-in-the-loop node that connects to the existing escalation configuration experience.
-
Access additional options by selecting the ⋮ (More actions) menu on a tool node. The following actions are available:
-
Add breakpoint – Inserts a breakpoint at the tool node. When the agent is debugged, execution pauses just before this tool runs, letting you inspect its inputs, outputs, and trace data. Breakpoints are useful for verifying tool logic and debugging errors during design-time testing.
-
Add guardrail – Opens the Guardrail configuration window, where you can define rules that restrict or monitor how the tool is used at runtime.
-
Disable – Temporarily disables the selected tool node from agent execution. Disabled tools remain on the canvas but are skipped during runtime and debugging, letting you test or refine the agent’s behavior without permanently removing the tool.

-
-
Debug your agent.
- Select Debug to run your agent in design time.
- As the agent executes, nodes light up in sequence to show the execution flow.
- If you run simulations, nodes appear in a different color to indicate mocked data or tool calls.
- For conversational agents, a persistent chat window lets you test exchanges; each message triggers a debug run that displays highlights across the connected nodes.
- You can also set breakpoints on specific nodes to pause execution and inspect inputs, outputs, and trace data.
-
Save and publish your changes.
- All updates in Canvas view are stored automatically and remain synchronized with Form view.
- When ready, publish the agent to make it available for testing and deployment.