- Release notes
- Getting started
- Installation
- Configuration
- Integrations
- Authentication
- Working with Apps and Discovery Accelerators
- AppOne menus and dashboards
- AppOne setup
- TemplateOne 1.0.0 menus and dashboards
- TemplateOne 1.0.0 setup
- TemplateOne menus and dashboards
- TemplateOne 2021.4.0 setup
- Purchase to Pay Discovery Accelerator menus and dashboards
- Purchase to Pay Discovery Accelerator Setup
- Order to Cash Discovery Accelerator menus and dashboards
- Order to Cash Discovery Accelerator Setup
- Basic Connector for AppOne
- SAP Connectors
- Introduction to SAP Connector
- SAP input
- Checking the data in the SAP Connector
- Adding process specific tags to the SAP Connector for AppOne
- Adding process specific Due dates to the SAP Connector for AppOne
- Adding automation estimates to the SAP Connector for AppOne
- Adding attributes to the SAP Connector for AppOne
- Adding activities to the SAP Connector for AppOne
- Adding entities to the SAP Connector for AppOne
- SAP Order to Cash Connector for AppOne
- SAP Purchase to Pay Connector for AppOne
- SAP Connector for Purchase to Pay Discovery Accelerator
- SAP Connector for Order-to-Cash Discovery Accelerator
- Superadmin
- Dashboards and charts
- Tables and table items
- Application integrity
- How to ....
- Working with SQL connectors
- Introduction to SQL connectors
- Setting up a SQL connector
- CData Sync extractions
- Running a SQL connector
- Editing transformations
- Releasing a SQL Connector
- Scheduling data extraction
- Structure of transformations
- Using SQL connectors for released apps
- Generating a cache with scripts
- Setting up a local test environment
- Separate development and production environments
- Useful resources

Process Mining user guide
Overview - Dashboard (role Monitoring User)
Introduction
This is the main monitoring dashboard, where you can keep track of the most important properties of a process. These properties are expressed in KPIs and Tags.
See illustration below.
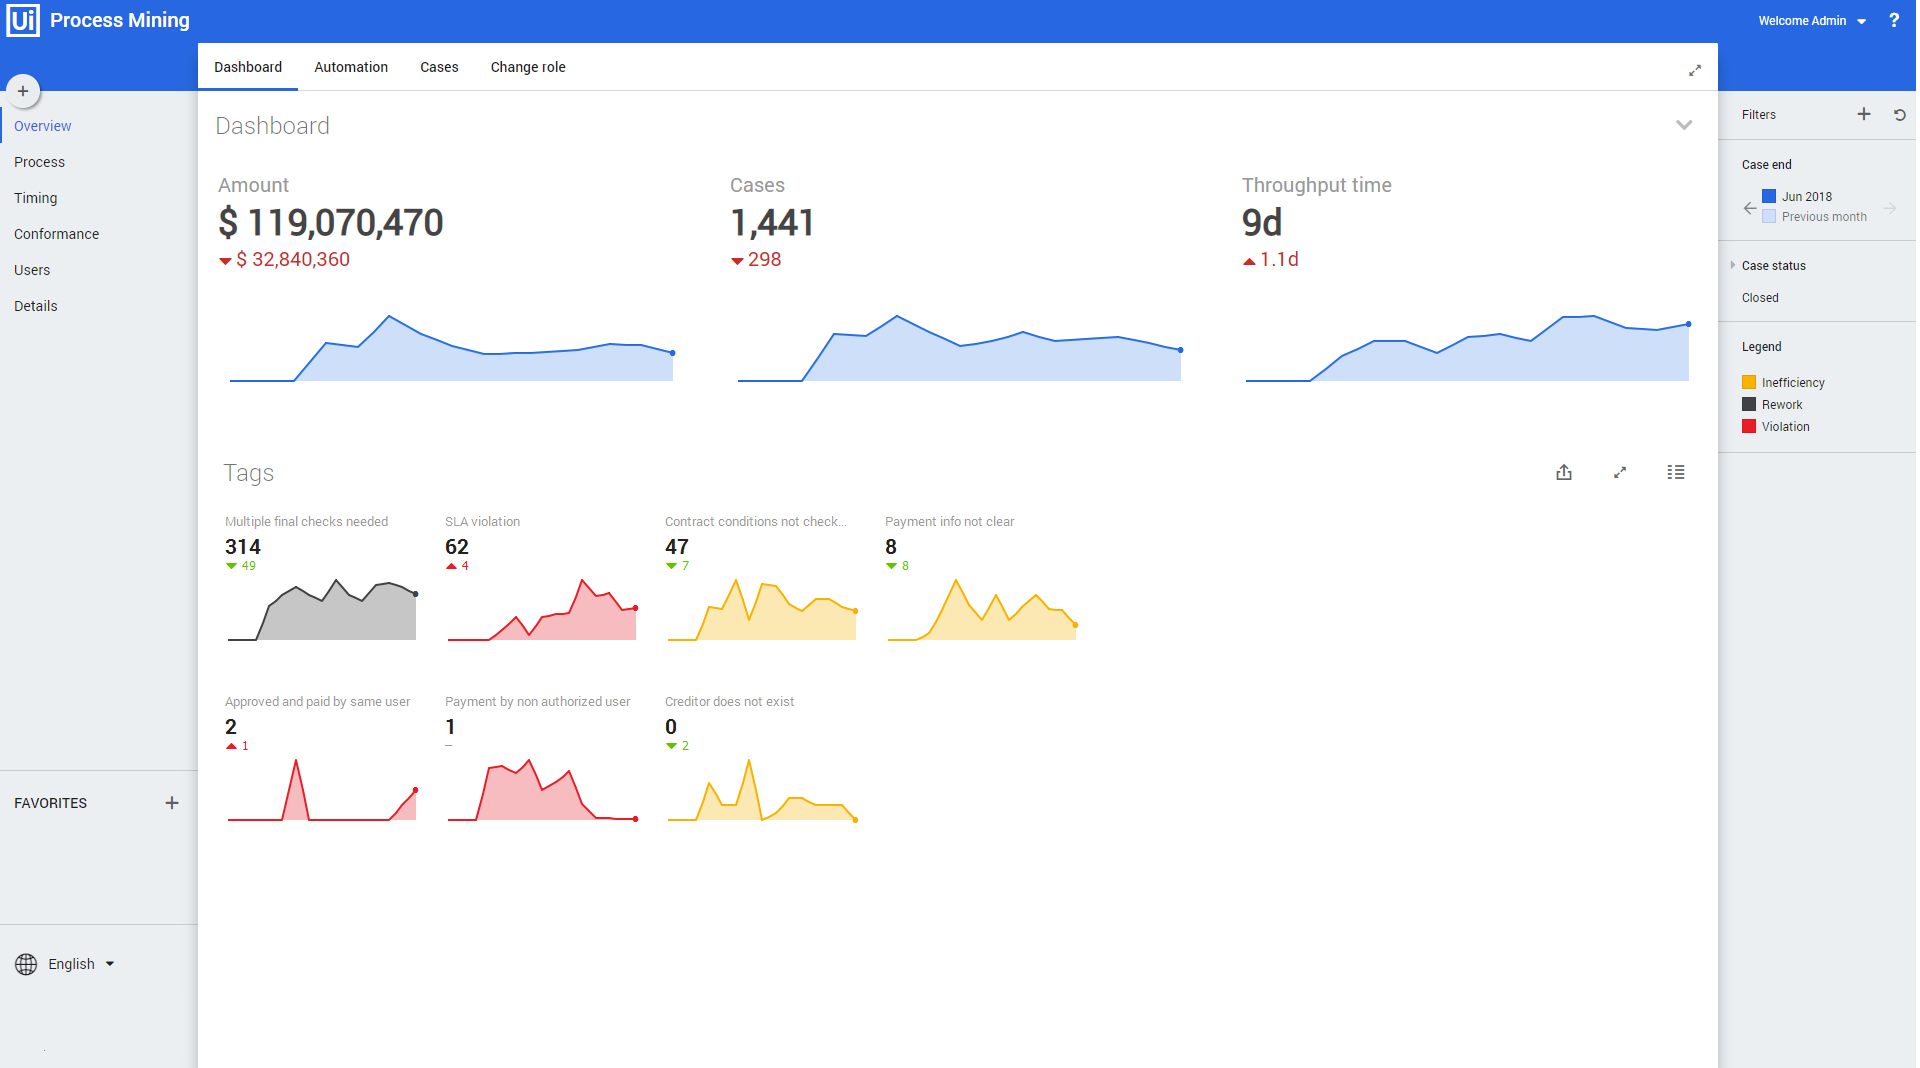
Number colors
BLACK numbers represent the figures of the selected period.
RED numbers represent the negative difference compared to the previous period.
GREEN numbers represent the positive difference compared to the previous period.
KPIs
Below is a description of the three most important KPIs regarding cases that are displayed on the top.
| KPI | Description |
|---|---|
| Amount | • Total amount of all cases in the selected period. • Decline or increase of the total amount compared to the previous period. • History chart displaying the total amount over the last 15 periods. |
| Cases | • Total number of all cases in the selected period. • Decline or increase of total number of cases compared to the previous period. • History chart displaying the total number of cases over the last 15 periods. |
| Throughput time | • Average throughput time of all cases in the selected period. • Decline or increase of the average throughput time compared to the previous period. • History chart displaying the average throughput time over the last 15 periods. |
See illustration below.

For each KPIa history graph is displayed. This history period can vary depending on the selected period.
Tags
On the bottom half of the dashboard, the total number of Tagsare displayed in a history graph for each Tag. See illustration below.

Legend
The graph color indicates the Tag type. See illustration below.
