UiPath Documentation
process-mining
latest
false
  • Release notes
    • 2026
      • February 2026
    • 2025
      • December 2025
      • November 2025
      • October 2025
      • September 2025
      • August 2025
      • July 2025
      • June 2025
      • May 2025
      • April 2025
      • March 2025
      • February 2025
      • January 2025
    • 2024
      • November 2024
      • October 2024
      • September 2024
      • August 2024
      • July 2024
      • June 2024
      • May 2024
      • April 2024
  • Managing access
    • Access to Automation CloudTM Public Sector
    • Enabling the service in Automation CloudTM Public Sector
      • Unified Pricing licensing
      • Flex licensing
    • Setting up the users
    • Managing access for process apps
    • Data capacity
  • Before you begin
    • System requirements
    • Process Mining feature availability
  • Getting started
    • Introduction to Process Mining
    • Process Mining
    • Architecture overview
    • Process Mining portal
      • Process apps tab
      • Development tab
  • Integrations
    • Setting up Automation integration
  • Working with process apps
    • Working with dashboards and charts
    • Working with process graphs
    • Working with Discover process models and Import BPMN models
    • Showing or hiding the menu
    • Context information
    • Export
    • Filters
    • Sending automation ideas to UiPath® Automation Hub
    • Tags
    • Due dates
    • Compare
    • Conformance checking
    • Process simulation
    • Root cause analysis
    • Simulating automation potential
    • Starting a Task Mining project from Process Mining
    • Triggering an automation from a process app
    • Viewing Process data
    • Process Insights (preview)
  • Creating apps
    • App Templates
    • Create new app wizard
      • Creating a new app
      • Selecting the app template
      • Defining the app properties
      • Selecting the data source
      • Mapping input tables
      • Mapping input fields
      • Finishing the app creation
    • Cloning an app
    • Exporting and importing process apps
    • Editing dashboards
    • Managing app permissions
    • Deleting an app
  • Loading data
    • Uploading data
    • Retrieving the credentials for the Azure blob storage
    • Loading data using CData Sync
      • Installing CData Sync
      • Create a source connection
      • Create a destination connection
      • Create a job
      • Run the job
      • Pseudonymizing data
      • Loading data from multiple source systems
      • Incremental extraction
      • Troubleshooting CData Sync
    • Loading data using Theobald Xtract Universal
      • Setting up Theobald Xtract Universal
      • Importing the template extractions
      • Configuring the source
      • Configuring the extraction script
      • Setting up DataUploader
      • Incremental extraction
      • Running the extraction script
      • Troubleshooting
    • Loading data using DataUploader
      • Running DataUploader
    • Incremental extraction
    • Managing file storage
    • Viewing logs
    • Optimizing an app
    • Scheduling Data Runs
  • Transforming data
    • Data transformations editor
      • Adding fields
      • Adding tables
      • Designing an event log
      • Using LLM functions in data transformations
    • Input data
      • Adding input tables
      • Deleting input tables
      • Managing input data
      • Manage file storage
    • Editing data transformations
      • Structure of transformations
      • Tips for writing SQL
      • Exporting and importing transformations
      • Viewing the data run logs
      • Merging event logs
      • Configuring Tags
      • Configuring Due dates
      • Configuring fields for Automation potential
      • Activity Configuration: Defining activity order
      • Making the transformations available in dashboards
    • Data models
    • Adding and editing processes
  • Customizing dashboards
    • Introduction to dashboards
    • Working with the dashboard editor
      • Uploading a development dataset
    • Creating dashboards
    • Dashboards
    • Charts
      • Bar charts
      • Stacked bar charts
      • Distribution charts
      • Table charts
      • Pivot table charts
      • Line charts
      • Process graphs
      • KPI trends lists
      • KPI values lists
      • Pie charts
      • Donut charts
    • Editing app settings
      • Setting data restrictions for a process app
    • Managing deviations
    • Data manager
      • Tables
      • Fields and metrics
        • Creating fields and metrics
        • Editing fields and metrics
        • Hiding and showing fields
        • Context metrics
        • Metric thresholds
        • Deleting fields
        • Deleting metrics
        • Duplicating metrics and fields
      • Expressions
        • Reference fields
        • Constants
        • Arithmetic
        • Aggregates
        • Compare
        • Logical
        • Text
    • Automation manager
    • Process models
      • Process mining types
  • Publishing process apps
    • Publishing process apps
  • App templates
    • Event log and Custom process app templates
      • Menus and dashboards
        • Overview
        • End to end
        • Event analysis
      • KPIs
      • Event log input fields
      • Custom process input fields
      • Configuring CData Sync for Event log or Custom process
    • Purchase-to-Pay app template
      • Purchase-to-Pay Process
      • Menus and dashboards
        • Summary
        • End to end process
        • Event analysis
        • Supplier performance
        • Maverick buying
        • Tag Details
      • KPIs
      • Purchase-to-Pay input fields
      • Configuring CData Sync for Purchase-to-Pay
    • Purchase-to-Pay SAP app template
      • Menus and dashboards
        • Summary
        • Process overview
        • Process velocity
        • Supplier performance
        • Maverick buying
        • Payment and discount
        • Accounting quality control
        • Tags overview
      • KPIs
      • Purchase-to-Pay - SAP input fields
    • Order-to-Cash app template
      • Order-to-Cash process
      • Menus and dashboards
        • Summary
        • End-to-end process
        • Event Analysis
        • Customers
      • KPIs
      • Order-to-Cash input fields
      • Configuring CData Sync for Order-to-Cash
    • Automation Log Monitor
      • Dashboards and KPIs
  • Notifications
    • My notifications
  • Additional resources
    • Out-of-the-box Tags and Due dates
    • Discover process model
    • Transformations
      • Custom throughput time metrics
      • SQL differences between Snowflake and SQL Server
    • Extending the SAP Ariba extraction tool
    • Performance characteristics
    • Basic troubleshooting guide
      • Process Mining service not visible
      • Data transformations
      • Uploading data
      • CData Sync
      • Integrated extractors
      • Process Optimization
UiPath logo, featuring letters U and I in white

Process Mining

Last updated Feb 18, 2026

Pie charts

Introduction

Pie charts can be used to compare the relative proportions of a certain metric within a category. The data in a pie chart is displayed in slices that form a circular graph. Each slice of the pie is relative to the size of the category used for the chart. The entire chart represents the total (number or 100%) of the category, while each slice represents a part of the total. The following illustration shows an example of a pie chart.


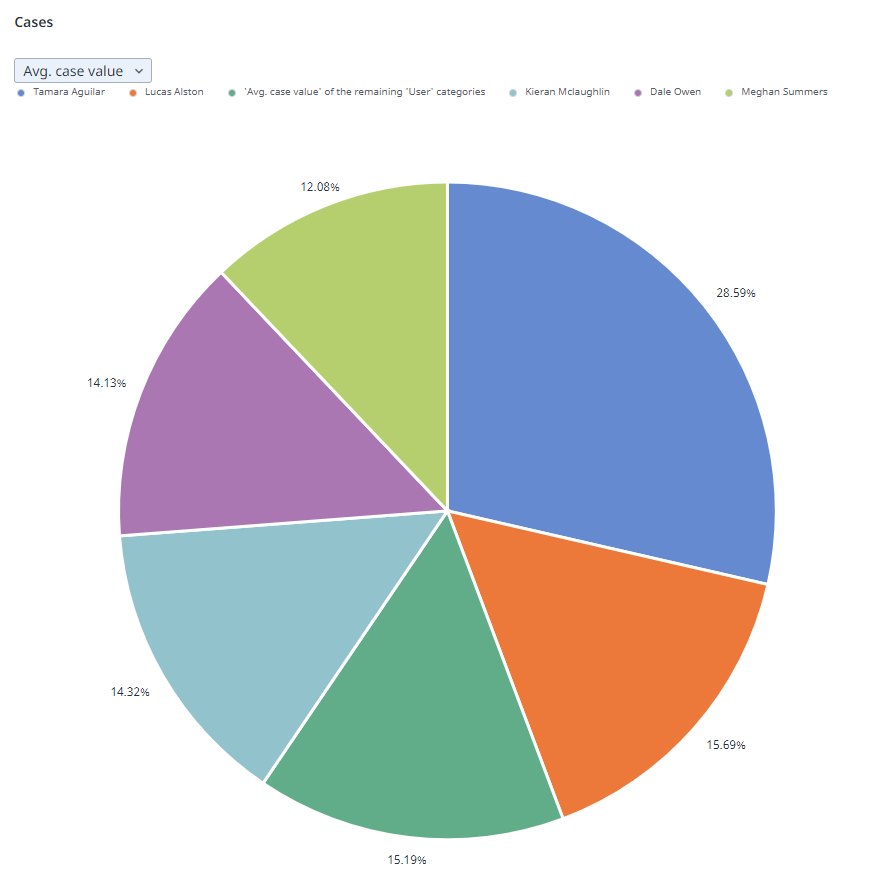
A legend is automatically generated for a pie chart.

Properties

You can edit the properties of a pie chart in the Edit pie chart panel.

The following table describes the properties of the Pie chart.

Element

Description

Title

Text box that enables you to edit the title of the pie chart.

Tooltip

Text box that enables you add a text that will be displayed as tooltip when the user hovers the mouse over the chart title in the published process app.

Category

List box that enables you to select the category used for the slices on the pie chart.

Metrics

List of metrics that define the values displayed on the slices.

  • Use the Add metric option to select one or more metrics that will be added to the metric selector.

  • Drag and drop the metrics in the list to arrange the metrics as desired.

Note:

You must at least select one metric. If you select multiple metrics, the first metric will be displayed by default.

Maximum number of slices

A pie chart displays up to six slices. If the data consists of more than five slices for the selected category, a sixth slice is displayed representing the combined total of the remaining categories that are not displayed individually.

The purpose of the sixth slice is to provide a complete picture of the data distribution, when not all categories are displayed individually. It shows the proportion of the data that is not covered by the top 5 individual categories in comparison to the whole.

  • Introduction
  • Properties
  • Maximum number of slices

Was this page helpful?

Connect

Need help? Support

Want to learn? UiPath Academy

Have questions? UiPath Forum

Stay updated